
Originally published September 13, 2024. Updated November 5, 2026.
Social media is no longer a channel. It is where people spend their day. Two thirds of the planet is on it, and in the US, YouTube and Facebook still reach most adults while TikTok and Instagram keep climbing.
Here are the social media usage statistics that matter in 2026, each with its source, and what they mean for a contractor deciding where to spend.
The short answer
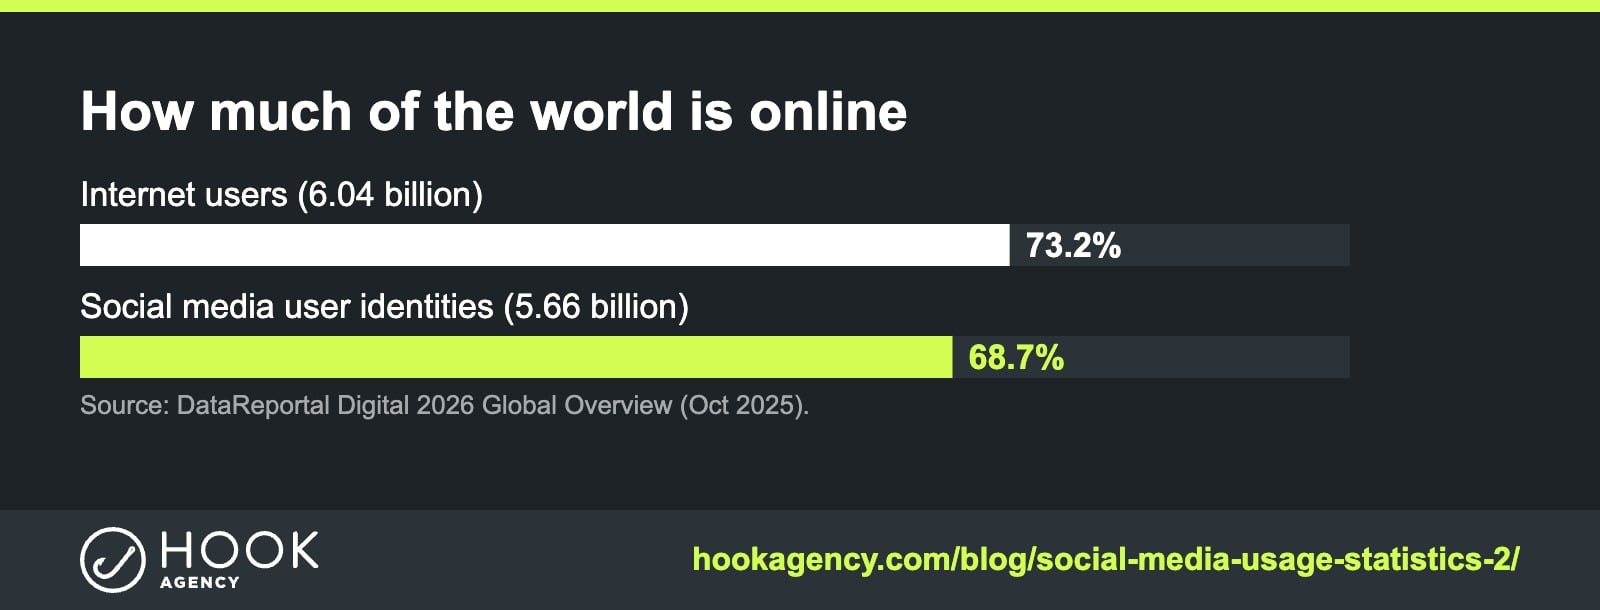
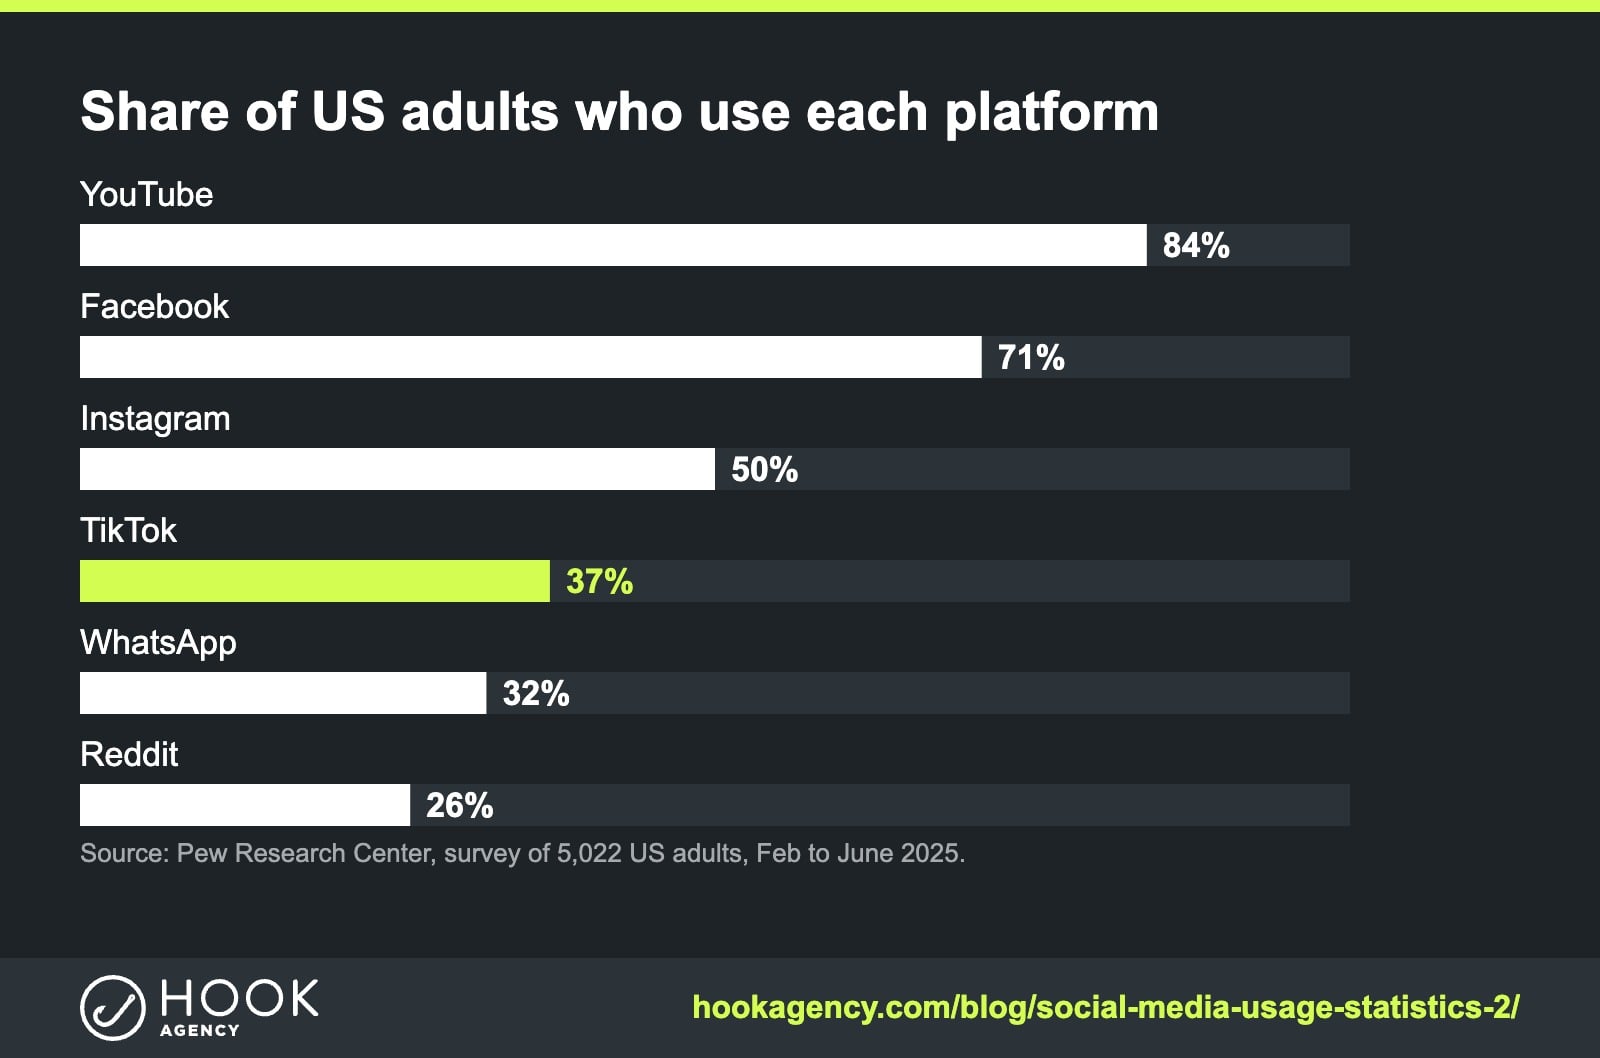
There are 5.66 billion social media user identities worldwide, 68.7% of the population (DataReportal, Oct 2025). In the US, 84% of adults use YouTube, 71% use Facebook, 50% use Instagram and 37% use TikTok (Pew, 2025). People spend well over 2.5 hours a day on social and video platforms.
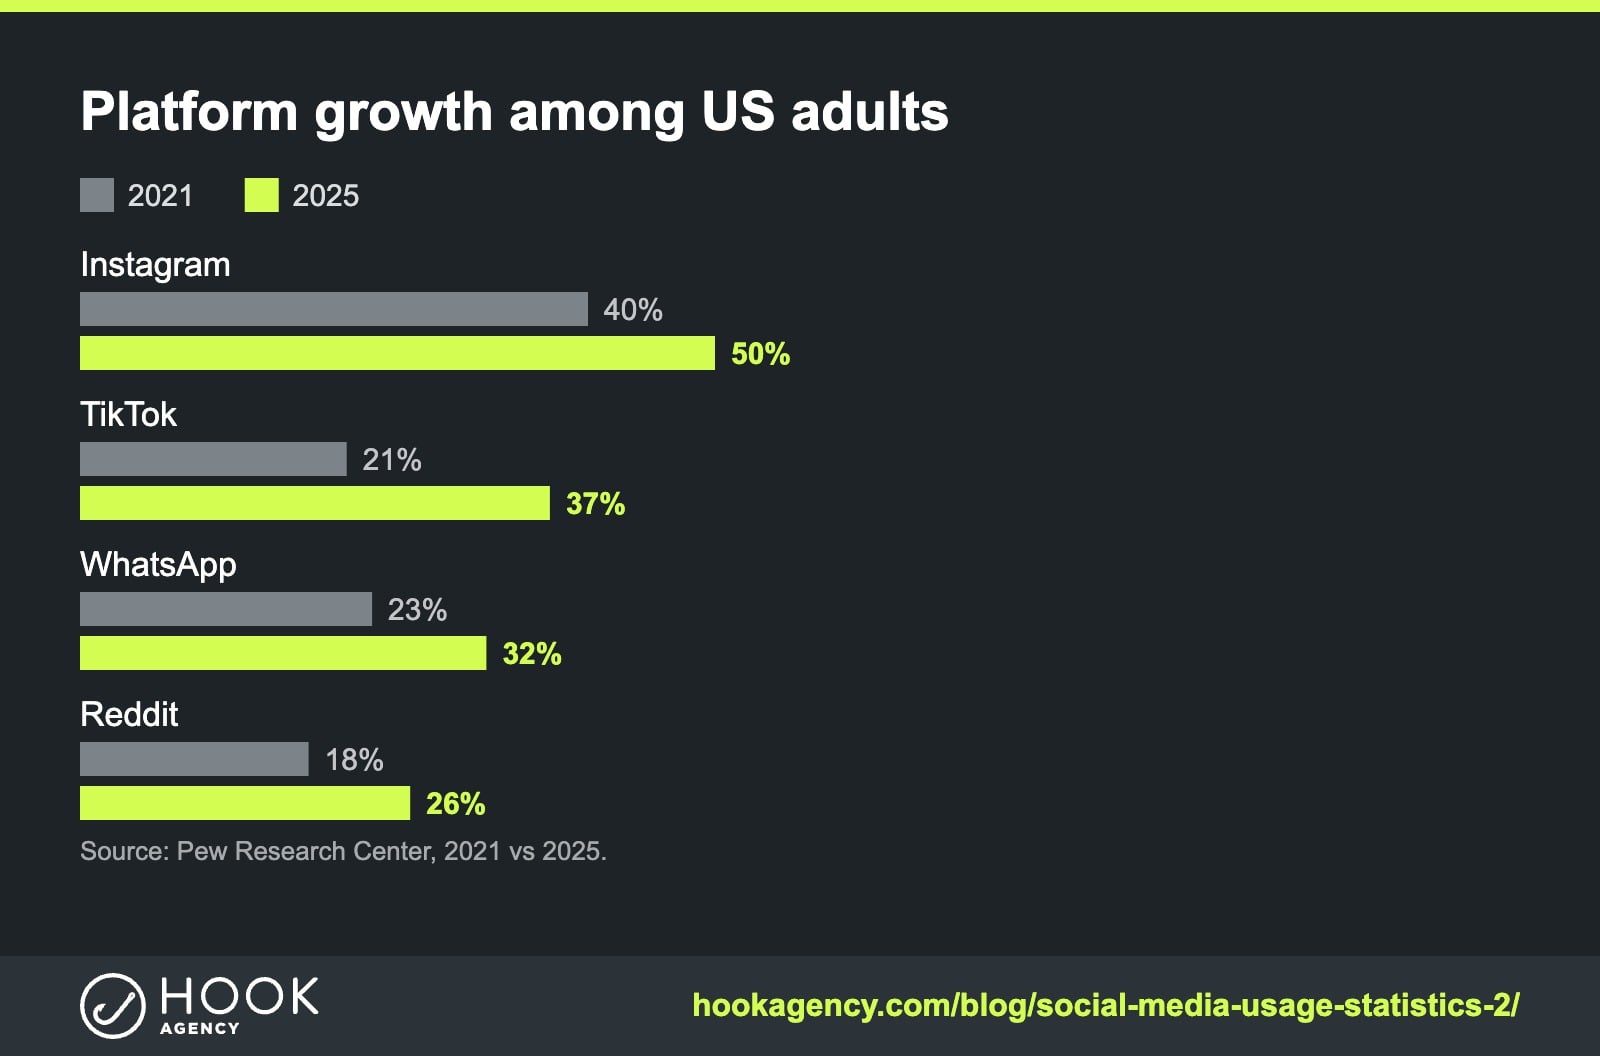
- TikTok use among US adults is up from 21% in 2021 to 37%
- About half of US adults use Facebook and YouTube daily
- People use 6.75 social platforms a month on average
Updated November 2026. New numbers up top. Older stats live in the historical section below, unchanged, so existing links and citations still work.
2026 social media usage statistics: the key numbers
Global social media use
- 5.66 billion social media user identities exist worldwide, equal to 68.7% of the global population. (DataReportal Digital 2026, Oct 2025)
- 6.04 billion people use the internet, 73.2% of the world. (DataReportal Digital 2026)
- 2.5+ hours a day is spent on social and video platforms when you include YouTube and TikTok. (DataReportal Digital 2026)
- 6.75 social platforms are used each month by the average internet user. (DataReportal, citing GWI Q2 2025)
- 1 billion+ people now use generative AI platforms every month. (DataReportal Digital 2026)
US social media use by platform
- 84% of US adults use YouTube, the most used platform in the country. (Pew Research Center, Nov 2025)
- 71% use Facebook. About half use it daily, and 37% use it several times a day. (Pew Research Center, 2025)
- 50% use Instagram, up from 40% in 2021. (Pew Research Center, 2025)
- 37% use TikTok, up from 21% in 2021. 24% of adults use it daily. (Pew Research Center, 2025)
- 32% use WhatsApp and 26% use Reddit. (Pew Research Center, 2025)
Who is growing
- +16 pts TikTok gained 16 points among US adults from 2021 to 2025, the fastest growth of any major platform. (Pew Research Center, 2025)
- +10 pts Instagram grew from 40% to 50% of US adults over the same period. (Pew Research Center, 2025)
What these numbers mean for contractors
For home service companies, social media is less about going viral and more about being seen by homeowners in your area. Here is how we read it:
- Facebook and Instagram are still where homeowners are. 71% of adults use Facebook and half use it daily. Meta ads are still the cheapest way to put real job photos in front of homeowners near you.
- YouTube is the sleeper. 84% reach. Short project videos and “how much does it cost” explainers work on YouTube and in Google results.
- TikTok is real now. 37% of adults use it. Crew culture and before and after content also helps recruiting.
- Do not spread thin. People use almost 7 platforms, but you do not need to be on all of them. Pick two and post real work every week.
Social will not replace search for emergency calls, but it builds the name recognition that makes people click your listing when they do search.
- Meta ads built from real crews and jobs
- Leads tracked to booked jobs
- You own your ad accounts
“Hook Agency has been an incredible partner for our digital marketing growth.”
Kristin Sullivan, Bob’s ACFocused on the map? See Google Maps SEO
Historical social media usage statistics (2024 edition and earlier)
Everything below is from our earlier editions, kept as is because many sites link to these numbers. Some figures are several years old, so check the original source date before citing.
In 2025, if you’re not leveraging the latest social media usage statistics to shape your marketing strategy, you’re already falling behind.
The game has changed dramatically:
- TikTok’s 1.3 billion active users are dictating trends.
- 88% of marketers reporting positive ROI from video means video isn’t optional anymore
- 58% of users buying directly via social media, platforms like Instagram and TikTok have become essential sales channels, not just brand awareness tools.
- The average user now spends over 2 hours and 45 minutes per day on social media, up from 2 hours and 27 minutes in 2020.
- Gen Z users average 4 hours per day on social platforms, with TikTok and Instagram accounting for the bulk of that time.
- 70% of users check social media at least 5 times a day, making it a constant touchpoint for brand visibility and engagement.
For marketers and home service business owners, these numbers aren’t just impressive, they’re a roadmap for where to focus time, budget, and strategy moving forward.

1. The Rise of New Platforms: Tap Into Emerging Audiences
Platforms such as TikTok, BeReal, and Threads have gained traction in 2024, but many businesses are still catching up. Let’s start by reviewing the numbers to understand where your audience may be headed.
- TikTok’s active users surpassed 1.3 billion in 2024, up from 1 billion in 2022. The app is now a major force, especially among Gen Z and Millennials .
- BeReal saw 25 million daily active users by Q3 2024, carving out a niche with its emphasis on authenticity .
- Threads by Meta reached 150 million monthly active users just a year after its launch .
Actionable Tip: If you’re not yet advertising or creating organic content for TikTok or Threads, now is the time. These platforms are still in their growth phase, making it easier to capture attention and build an audience early. Authenticity and raw content do particularly well, especially for small businesses.
2. Video Content is Non-Negotiable
The push for short-form video continues, and the statistics around engagement make it impossible to ignore.
- Reels generate 22% more engagement on Instagram than traditional posts .
- 88% of marketers who use video say it gives them a positive ROI, a figure that’s consistently risen year over year .
- YouTube Shorts now boasts 2.5 billion logged-in monthly users, proving its value for marketers looking for short, engaging content .
Actionable Tip: Home service businesses can benefit immensely by showcasing behind-the-scenes content, customer testimonials, or service demos in video format. Focus on short, digestible videos to engage your audience on platforms like Instagram, TikTok, and YouTube Shorts.
3. Social Commerce is Booming
Social media isn’t just about brand awareness anymore; it’s a direct path to purchase.
- 58% of users reported they have purchased something via social media in 2024, an increase from 49% in 2022 .
- Instagram and Facebook lead in social commerce, but TikTok is closing the gap, with 40% of users purchasing products discovered on the app .
Actionable Tip: Integrate social commerce into your strategy. Home service businesses can take advantage of features like Instagram Shop, TikTok’s in-app shopping, and Facebook Marketplace to sell services, accessories, or related products.
4. Ad Spend Continues to Shift to Digital
With the digital world thriving, companies are allocating more of their budget to social media advertising.
- Global social media ad spend is projected to hit $207 billion by the end of 2024, up 11% from 2023 .
- Businesses that invest in social media advertising see a return of $5.20 for every $1 spent, a strong indicator that ads are paying off .
Actionable Tip: Small businesses should allocate part of their budget to targeted social media ads, particularly on platforms where they can capture niche audiences (TikTok, Instagram). Focus on retargeting past visitors and segmenting audiences to drive conversions.
5. Messaging Apps Are the Future of Customer Service
Messaging apps are taking a central role in how customers interact with businesses.
- WhatsApp, Messenger, and Instagram DM are used by 85% of consumers to contact businesses in 2024 .
- 72% of users expect brands to offer direct messaging support, and brands that respond quickly see higher customer loyalty .
Actionable Tip: Implement a robust messaging strategy that includes automation for common queries and human interaction for more complex requests. Messaging can help home service businesses offer immediate quotes, book appointments, or follow up with customers after a service.
6. Influencer Marketing Remains Strong, but Micro-Influencers Reign Supreme
While influencers are still powerful, businesses are seeing more ROI by collaborating with smaller, niche influencers.
- Businesses are projected to spend over $21 billion on influencer marketing by the end of 2024 .
- Micro-influencers (10k-50k followers) drive 60% higher engagement rates than larger influencers, making them a cost-effective choice for small businesses .
Actionable Tip: Home service businesses should partner with micro-influencers in their local areas. A collaboration with a local influencer could yield better brand trust and awareness than working with national figures.
7. User-Generated Content Builds Trust
People trust real customers more than they trust brands.
- 84% of millennials say user-generated content on social media influences their purchasing decisions, and 70% of people trust content from real customers over branded content .
Actionable Tip: Encourage your customers to share their experiences on social media, using hashtags or tagging your business. Feature their content on your profile to build trust and showcase real-world examples of your services.
8. Instagram Stays Dominant, But Engagement is Key
Instagram remains one of the most powerful platforms for businesses, but engagement, not just follower count, is what matters most.
- Instagram boasts over 2.35 billion monthly active users as of late 2024 .
- Posts with a call-to-action (CTA) are 40% more likely to engage users, yet only 10% of businesses regularly use them .
Actionable Tip: Always include a CTA in your social posts, whether it’s encouraging comments, sharing posts, or driving traffic to your website. Engagement algorithms prioritize content that prompts interaction, so keep that in mind when crafting posts.
9. Voice Search and Social Audio are Emerging Trends
The intersection of voice and social media is growing, and businesses should be paying attention.
- 45% of all internet searches will be conducted via voice by the end of 2024, impacting how people discover businesses on platforms like Facebook and Instagram .
- Social audio platforms like Clubhouse have stabilized at around 25 million users, with more interest in live discussions around niche topics .
Actionable Tip: Optimize your content for voice search and consider hosting live Q&A sessions or discussions on social audio platforms. This could be an excellent opportunity for home service businesses to answer customer questions in real time.
10. LinkedIn’s Professional Edge
For B2B businesses, LinkedIn continues to dominate in 2024.
- LinkedIn now has over 1 billion users .
- 93% of B2B marketers consider LinkedIn their top social platform for lead generation, and posts with high-quality visuals see up to 80% more engagement .
Actionable Tip: Use LinkedIn to network with other businesses, share thought leadership, and offer value. Home service companies targeting B2B clients should capitalize on LinkedIn’s robust professional network.
Harness the Power of Social Media Usage Statistics in 2025
As social media evolves, staying on top of trends and data is essential for businesses looking to grow. The 2024 social media usage statistics paint a clear picture: video content is essential, new platforms are making waves, and user expectations are changing. Small businesses, particularly those in home services, can benefit greatly by adapting their strategies to fit these trends.
Leverage these insights to create a more engaging, customer-focused social media presence and ensure you’re not left behind as the landscape continues to shift.
From our earlier social media addiction and usage statistics page
We merged our older social media addiction and usage page into this one. Its stats are below, unchanged.
Social media is dangerous.
Or is it dangerously good?
Or is it so dangerously good – we should actually be concerned about our own mental health, and the health of society in general.
With something that dangerous – we also know it’s powerful for marketing. So these statistics outlay the current difficulty, but also the current opportunity.
Use responsibly.

Social Media Usage Statistics for 2024
- As of 2024, the number of social media users worldwide is over 4.2 billion (Datareportal, 2024).
- Mobile users account for approximately 91% of all social media users (Datareportal, 2024).
- The average user spends around 2 hours and 24 minutes per day using social media across multiple devices (GlobalWebIndex, 2021).
- Facebook remains the most used social media platform, with over 2.8 billion active users as of 2024 (Facebook, 2024).
- Instagram has more than 1.2 billion monthly active users (Instagram, 2024).
- TikTok, the short-video platform, has over 1 billion active users worldwide (TikTok, 2024).
- Around 500 million tweets are sent each day on Twitter (Internet Live Stats, 2024).

Social Media Addiction Statistics for 2024
- Approximately 210 million people suffer from internet and social media addictions worldwide (The Recovery Village, 2021).
- A survey found that 71% of millennials check social media sites first thing in the morning (OnePoll, 2021).
- The average person will spend nearly five and a half years of their lifetime on social media, according to calculations using average daily use figures (Mediakix, 2021).
- 45% of teenagers feel overwhelmed by the number of notifications they receive daily (Common Sense Media, 2021).
- A survey by the Royal Society for Public Health in the UK ranked Instagram as the worst social media platform for mental health among young people (RSPH, 2021).

Social Media and Mental Health Statistics for 2024
- Frequent social media use and screen time have been shown in several studies to be strongly associated with increased risk for depression, anxiety, and loneliness (Journal of Adolescence, 2021).
- Social media may contribute to sleep disturbance – one study reveals that young adults who spend a lot of time on social media have twice the risk of suffering from sleep problems (University of Pittsburgh, 2021).
- Research suggests that young people who spend more than 2 hours per day on social media are more likely to report poor mental health, including psychological distress (symptoms of anxiety and depression) (Centers for Disease Control and Prevention, 2021).
- The “fear of missing out” (FOMO) phenomenon that is often associated with social media usage, has been linked with decreased sleep quality, lower mood, increased anxiety, and feelings of loneliness (Journal of Social and Clinical Psychology, 2021).
- Comparing oneself to others on social media has been found to have a greater impact on one’s self-esteem than direct comparisons in real life (Journal of Adolescence, 2021).

Social Media Marketing Statistics for 2024
- 90% of brands use social media to increase brand awareness (Emarsys, 2021).
- Nearly 73% of marketers believe that their efforts through social media marketing have been “somewhat effective” or “very effective” for their business (Buffer, 2021).
- As of 2024, the average business spends between 20 – 30% of its total marketing budget on social media advertising (Web Strategies, 2024).
- The number of small businesses advertising on Facebook doubled to 50 million in 2024, highlighting the increasing importance of social media in marketing strategies (Facebook, 2024).
- 71% of consumers who have had a positive experience with a brand on social media are likely to recommend the brand to their friends and family (Lyfe Marketing, 2021).
- Instagram’s potential advertising reach is 1.16 billion users (Hootsuite, 2024).
- LinkedIn is the top-rated social network for lead generation – 79% of B2B marketers say LinkedIn has been an effective avenue for lead generation (LinkedIn, 2021).
- Over 200 million Instagram users visit at least one business profile daily (Instagram, 2024).
- By 2024, it’s predicted that the average daily time each user spends on social media will be 115 minutes, up from 102 minutes in 2022 (eMarketer, 2024).
- Over 80% of consumers discover products they like on Facebook (Facebook, 2024).

The power of social media is a double-edged sword.
Its omnipresence, reflected in the compelling statistics, underlines the incredible influence it has on our lives and businesses. However, this influence is not without its drawbacks, as seen in the rising concerns around addiction and mental health.

The business advantages are undeniable; social media is a game-changer in marketing, offering reach and engagement that traditional mediums cannot match. Yet, these boons demand a balanced approach.
As we navigate 2024, we’re reminded of the fine line between beneficial use and harmful excess. Use responsibly, understand the impact, and strike a balance. Social media is a tool – it’s our responsibility to wield it wisely. Let’s connect, inspire, and grow, but never at the expense of our well-being.
How to cite this page
Hook Agency, “Social Media Usage Statistics (2026),” hookagency.com/blog/social-media-usage-statistics-2/, updated November 2026. For any single number, please cite the original source linked next to it.
Frequently Asked Questions
How many people use social media in 2026?
About 5.66 billion social media user identities, or 68.7% of the world’s population, according to DataReportal’s Digital 2026 report.
What is the most used social media platform in the US?
YouTube. 84% of US adults use it, followed by Facebook at 71% (Pew Research Center, 2025).
How many US adults use TikTok?
37% in 2025, up from 21% in 2021, per Pew Research Center.
How much time do people spend on social media a day?
Well over 2.5 hours a day when you include video platforms like YouTube and TikTok (DataReportal, 2026).
Which social platform is best for contractors?
Facebook and Instagram for paid reach to local homeowners, and YouTube for project and cost videos. Pick two and post consistently.