Originally published March 11, 2020. Updated November 5, 2026.
The construction industry in 2026 is big, a little slower and more expensive to run. Spending is down slightly, materials costs jumped, and contractors still cannot hire fast enough.
Here are the construction statistics that matter this year, each linked to its source, followed by what they mean if you run a construction or remodeling company.
The short answer
US construction spending was $2.16 trillion in 2025 and is running 2.9% behind that pace through September 2026 (Census). The industry employs 8.36 million people at an average $41.69 an hour (BLS, Sept 2026). Materials prices were up 9.6% year over year in May 2026 (ABC), and the industry needs about 349,000 net new workers this year.
- Housing starts: 1.22 million annual rate in September 2026
- Construction unemployment: 3.5%
- Average contractor backlog: 9.1 months
Updated November 2026. New numbers up top. Older stats live in the historical section below, unchanged, so existing links and citations still work.
2026 construction statistics: the key numbers
Construction spending
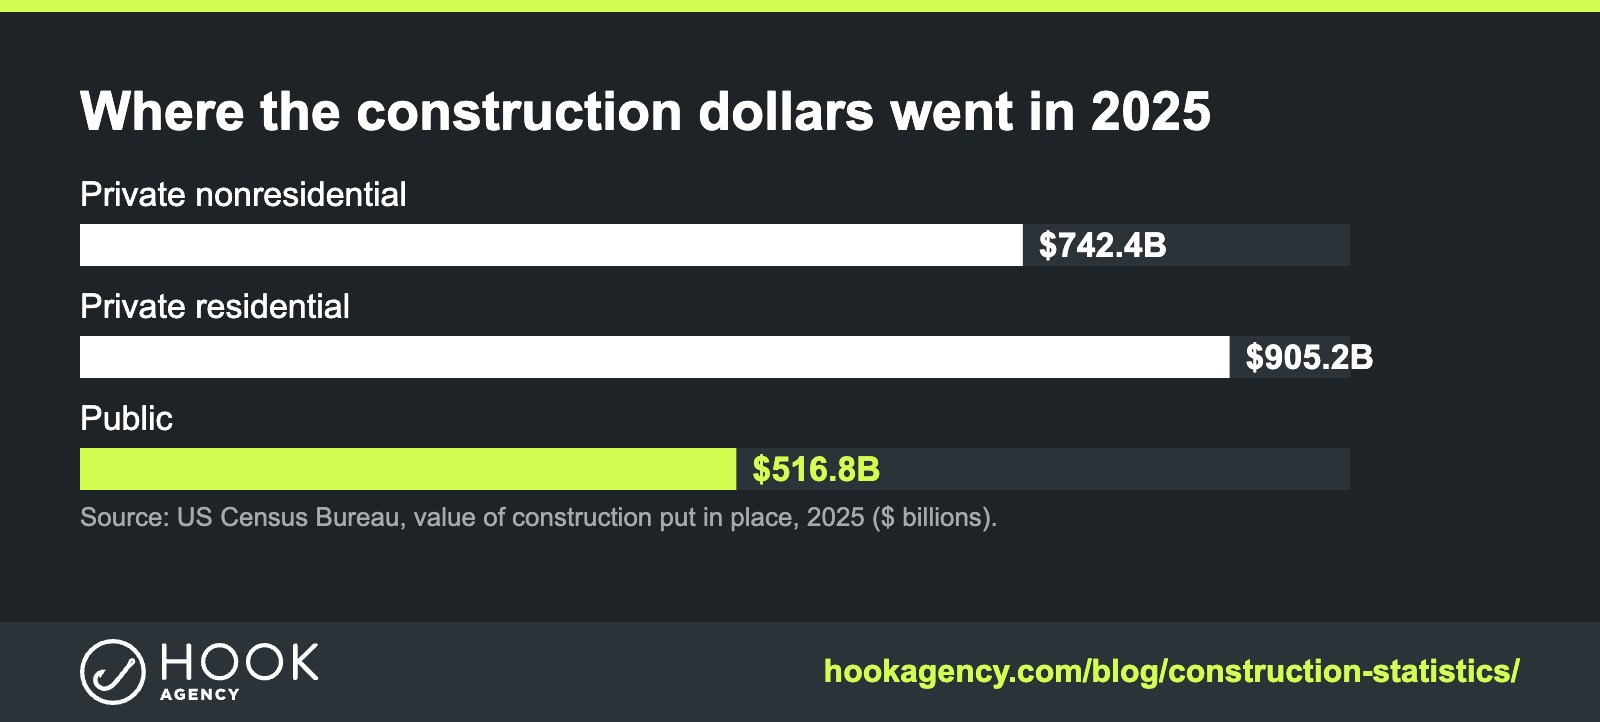
- $2.16 trillion was spent on US construction in 2025, down 1.4% from 2024. (US Census Bureau)
- 2.9% is how far 2026 spending through September trails the same period of 2025. (US Census Bureau, Nov 2026)
- $516.8 billion in public construction in 2025, up 3.6%, while private spending fell 2.9% to $1.65 trillion. (US Census Bureau)
- 4.3% of US GDP came from construction in Q4 2025. (BEA via FRED)
Construction employment and pay
- 8.36 million people work in US construction (September 2026). (BLS, Construction industry at a glance)
- $41.69 is the average hourly earnings for construction employees. (BLS, Sept 2026)
- 289,000 construction job openings were posted, with unemployment at 3.5%. (BLS, Sept 2026)
- 349,000 net new workers are needed in 2026, and about 456,000 in 2027. (Associated Builders and Contractors, Jan 2026)
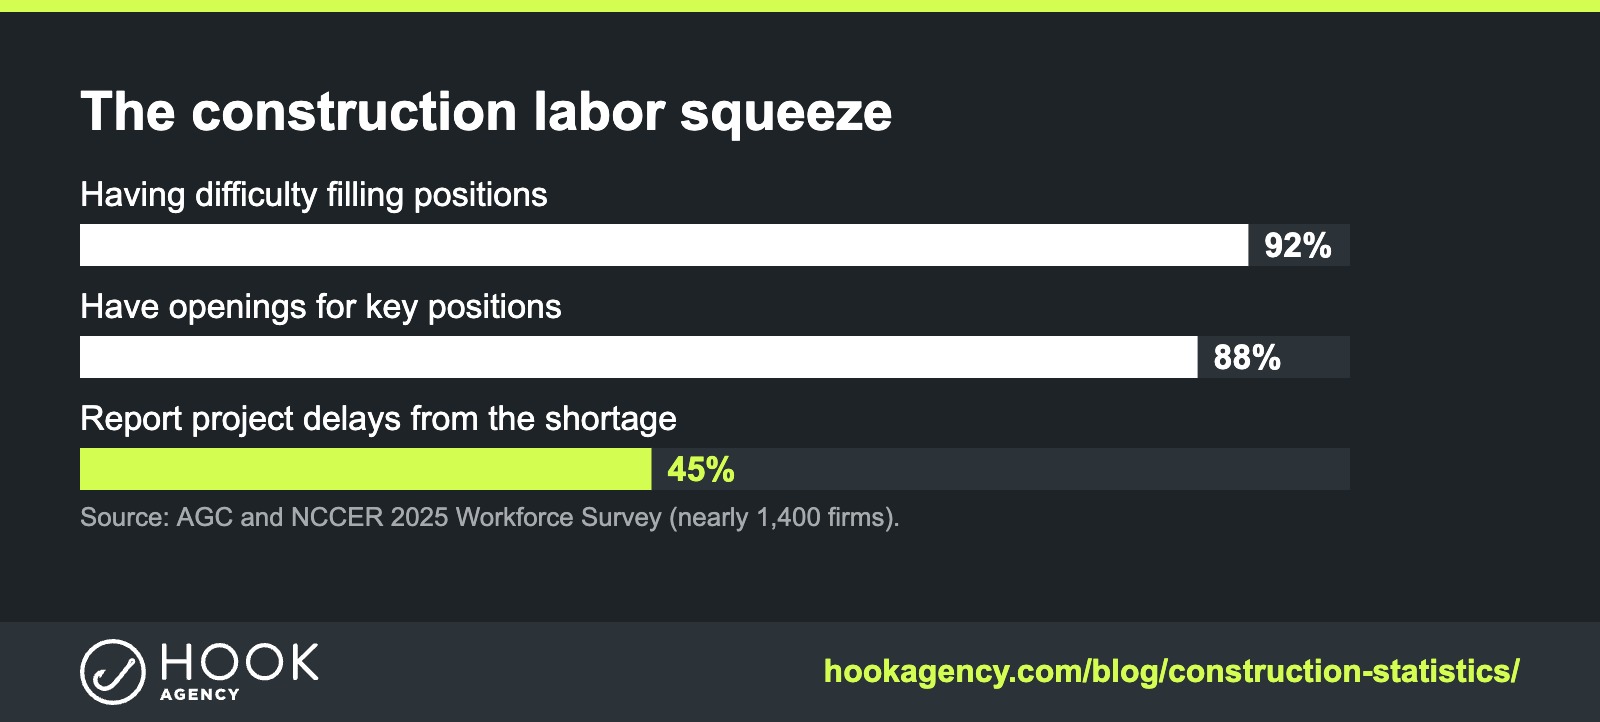
- 92% of firms have trouble filling positions, and 45% report project delays from the shortage. (AGC and NCCER Workforce Survey, 2025)
Housing construction
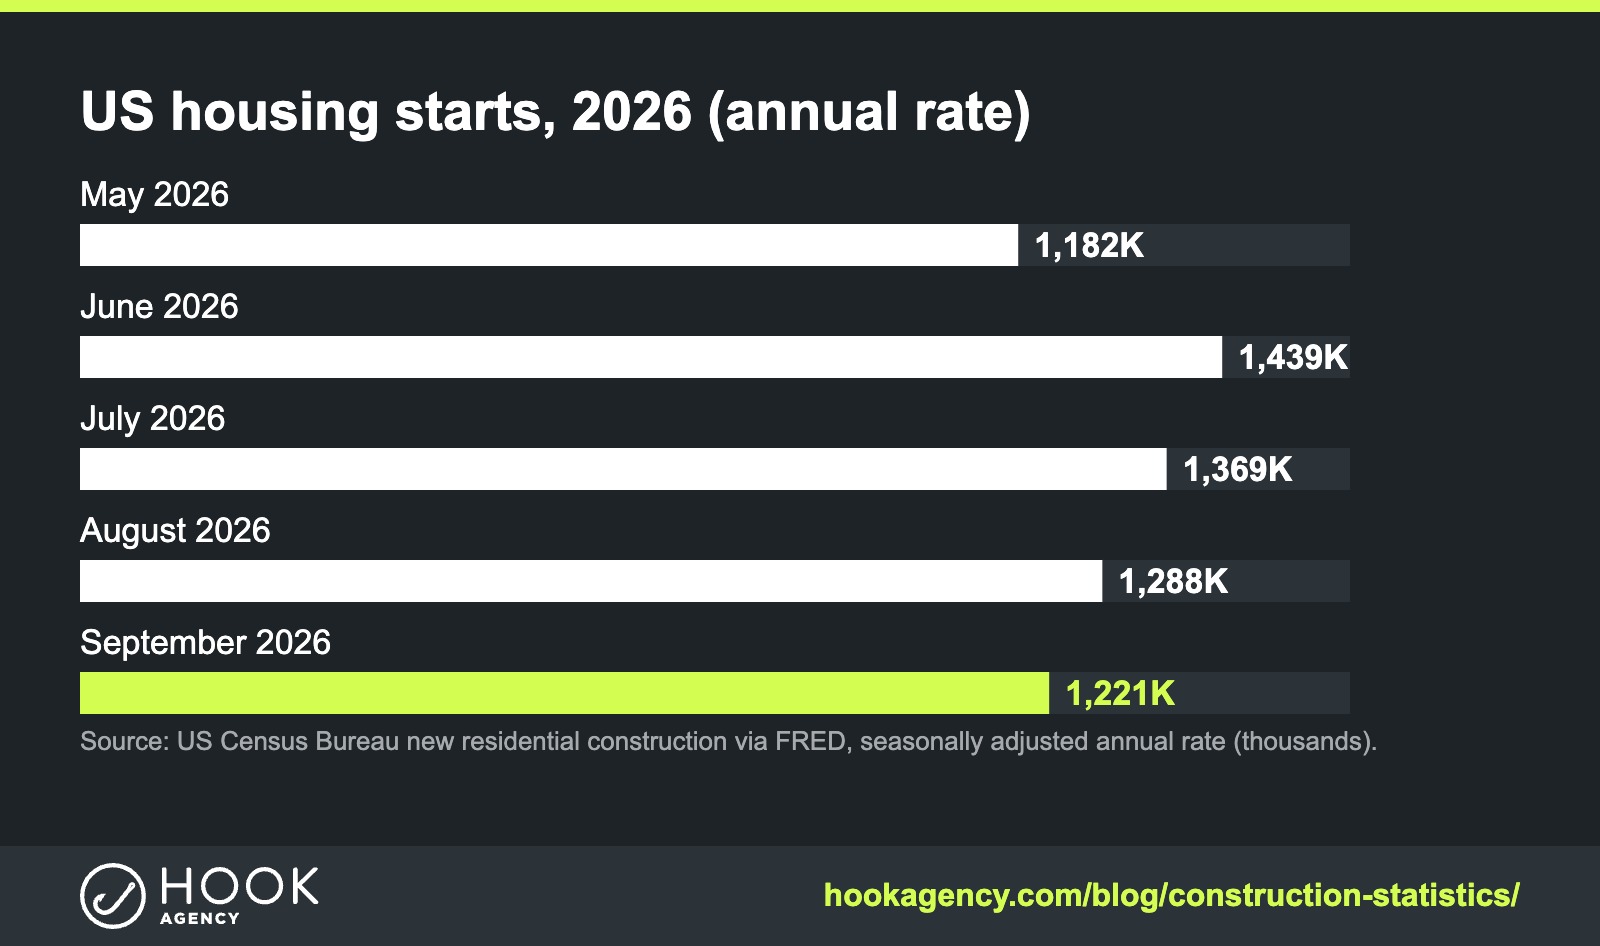
- 1.22 million housing starts at a seasonally adjusted annual rate in September 2026, down from 1.44 million in June. (US Census Bureau via FRED, Oct 2026)
- $917.4 billion was spent on residential construction in 2025, down 2.5%. (US Census Bureau)
Costs, margins and backlog
- 9.6% was the year over year jump in construction materials prices in May 2026. Prices rose 2.6% in that month alone. (ABC analysis of BLS data, via Floor Daily)
- 6.7% was the average net profit before tax for contractors. (CFMA Financial Benchmarker, 2025)
- 9.1 months of backlog was the ABC Construction Backlog Indicator in May 2026. (ABC via BD+C)
What these numbers mean for contractors
Here is how we read 2026 for the builders, remodelers and trade contractors we work with:
- Costs moved faster than prices. With materials up almost 10% in a year and margins under 7%, update your pricing and your estimates. Do not let old bids eat your profit.
- Residential is softer. Housing starts slid through the summer. Remodelers and replacement trades should lean on service and repair demand.
- Labor is the bottleneck. 92% of firms struggle to hire. A recruiting page, real crew photos and a reputation as a good place to work are marketing assets.
- Backlog is healthy. 9 months of work in the pipeline means most contractors are busy. The ones who keep marketing through a full backlog are the ones who stay full next year.
A tighter market rewards contractors who treat marketing as a steady system, not something they turn on when the schedule goes empty.
- Leads from Google, Maps and AI search
- Nobody else is buying the same lead
- You own your website and ad accounts
“Hook Agency has been an incredible partner for our digital marketing growth.”
Kristin Sullivan, Bob’s ACFocused on the map? See Google Maps SEO
Historical construction statistics (original edition)
Everything below is from the earlier edition of this page, kept as is because many sites link to these numbers. Some figures are several years old, so check the original source date before citing.
The construction industry is and has been one of the highest revenue-generating industries in the world and is an industry that is always changing with current economic and social conditions.
There is growth in many industries of construction such as single-family homes or home improvement projects. It is also seeing several changes in the employment side of things as well such as an increase in female workers and minorities.
The demand for evolving technologies to help increase safety and efficiency on the job site is also a growing field. New technologies are also coming out in the areas of eco-friendly and more sustainable options that help make things more environmentally friendly.

The industry is also seeing some challenges with over 90% of contractors having concerns about having workers with adequate skill levels for the job, causing some to even turn away business.
With what seems like the ever-changing world of construction and trends, it is important that you are staying on top of different things going on within the industry.
Check out these construction statistics and see what the industry looks like today.
Construction Location
1.) Construction in the Western United States was projected to grow by 6.2% between 2018 and 2019. [FMI]
2.) 20% of construction in the United States takes place in New York, Dallas, Houston, Los Angeles, and Washington. [Built Worlds]
3.) Over the next 5 years, 50% of construction in the U.S. is expected to take place in just 20 cities. [Built Worlds]
4.) New York City is the most expensive city to build in 2019 costing $417/sq ft. [Curbed]

Construction Market
5.) Single-family residential construction is estimated go up 4% from 2017 and projected to be at $282 billion. [FMI]
6.) Multi-family residential construction rose by 1% last year, with an estimated value of $67 billion. [FMI]
7.) Home improvement spending rose by 5% in 2018. [FMI]
8.) Amusement and recreation grew by 8% because of big-budget stadiums and arenas, and amusement parks. [FMI]
9.) The segments of nonresidential leading spending growth for 2018 are transportation (+16%), lodging (+14%), and office (+11%) [FMI]
10.) Commercial construction is broken down into the following segments: 7%, lodging; 15%, office; 17%, shopping facilities; 8%, health care; 5%, education; 3%, recreation; 4%, transportation; 5%, communication; 21%, energy; and 15%, manufacturing. [ctasc]
11.) In the coming year, we will see growth for the education (3.9%), office (3.0%) and institutional (2.9%) segments, and “public safety” projects, projected to grow by 7.2%. [archinect]
12.) Over the next two years, markets such as religious (-1.9%), amusement (-1.8%), retail (-1.3%), and hotel (-0.7%) markets are expected to decrease. [archinect]
13.) In a recently published economic report from the American Institute of Architects, nonresidential construction is expected to grow 1.5 percent through 2020, and less than a one percent increase in 2021. [archinect]

Construction Industry
14.) Global construction costs are expected to rise an average of 4.3%. [Turner & Townsend]
15.) Global construction market will grow to $8 trillion by 2030 [GCP]
16.) Growth in the Middle East and Africa region slowed to 2.2% from 2014 to 2018 but is expected to rise with an average of 5.5% between 2019 to 2024 [Research and Markets]
17.) Construction activity in Latin America was expected to grow by 1.2% in 2019 and is predicted to have an average growth of 3% from 2020 to 2024 [Research and Markets]
18.) The annual growth of the US construction industry from 2014 to 2019 was 8.3% [IBISWorld]
19.) US construction market is set to grow faster than China’s over the next fifteen years [GCP]
Construction Demographics
20.) About 85% of the construction industry was born between 1960 and 1995. [JBK]
21.) 30% of the construction workforce identifies as Hispanic or Latino. [Bureau of Labor Statistics]
22.) 10% of the total construction workforce is female. [Bureau of Labor Statistics]
23.) 15.6% of the women in construction work in accounting. [JBK]

Construction Spending
24.) The amount of money spent on construction in the United States topped $1.29 trillion in 2018. [Statista]
25.) Transportation construction rose by 16% in 2018 with airport redesigns being a large factor. [FMI]
26.) Costs of global construction is expected to rise by an average of 4.3%. [Turner & Townsend]
27.) 77% of construction spending took place in the private sector in 2018 at $992 billion. [Statista]
28.) Construction in the form of improvements had a growth of 5% from 2017-2018 and reached $205 billion in spending. [FMI]
29.) 4G technology is plateauing and 5G technology is just in its infant stage. 5G uses many low powered cells instead of cell towers and has an estimated infrastructure of just under $300 billion and is projected to be mainstreamed by 2025. [FMI]
Construction and Environment Improvement
30.) Buildings account for about 40% of the global energy-related CO2 emissions. [USGBC]
31.) Emissions from commercial buildings may increase by 1.8% in 2030 (Bold Business)
The value of green homes may increase in value by up 10% and increase the resale value as well. [USGBC]
32.) The global green buildings market is expected to grow at a compound annual growth rate of 10.26% from 2018 to 2024. [MRFR]
33.) Green buildings can reduce carbon emissions by 34% and use up to 25% less energy than conventional buildings. [MRFR]
34.) The residential segment of the green market is dominant with a global share of 60.9% and $123.4 million in 2018. [MRFR]
35.) Experts predict the segment of the nonresidential green building segment to have a compound annual growth rate of 9.25% by the end of 2024. [MFRF]
Construction Employment
36.) The construction industry had 11.2 million people working in 2018. [Bureau of Labor Statistics]
37.) The average hourly wage of construction employees was $31.08 in 2019. [Bureau of Labor Statistics]
38.) Experts estimate a 1.2% growth of jobs over the next ten years. [Data USA]
39.) Construction unemployment rates are around the 4% mark. [FMI]
40.) The average yearly salary of professionals in the construction industry is $51,097. [Data USA]
41.) 71% of midwest contractors have reported having trouble finding skilled workers. Whereas 44% of contractors in the northeast and only 22% of contractors in the Northeast had difficulty finding workers. [USCC]
42.) 89% of U.S. general contractors reported that they are concerned about labor shortage. [USCC]
43.) 53% of small construction companies have turned down work opportunities due to skilled labor shortages. [USCC]
44.) 92% of contractors reported being moderately concerned at the least about their workers having acceptable skill levels. [USCC]
Technology in Construction
45.) Construction businesses are looking to implement the following features in construction management platforms: project tracking (73%), job costing (72%), project estimating (66%), improved accuracy (47%), and process standardization/automation (39%). [Software Connect]
46.) There has been $10 billion put into the funding of construction technology in the past ten years. [FIM]
47.) When autonomous vehicles were mixed with human-operated excavators, there was a 40% improvement in efficiency compared to conventional means. [The B1M]
48.) In 2018, 18% of small and medium-sized construction companies were using drones. [Software Connect]
49.) About 60% of construction companies have an R&D department for new technology purposes. [JBK]
50.) Apple is used by 78.7% of companies using a mobile operating system. |JBK|

Thanks for reading!
High-end home building statistics
We merged our older page, “5 High-End Home Building Stats to Know”, into this one. Its stats are below, unchanged.
Paying attention to industry statistics and trends is important regardless of the field your business operates in.
When you are in-tune with the ebbs and flows your industry, you’ll be better equipped to make the necessary changes to combat these trends.
This is especially true for the home building industry. Paying attention to industry and nationwide statistics allows you to understand where the home buying market is as a whole.
It can also tell you how to market your business and get in front of your target market.
The home market can be volatile at times, as its success is closely aligned to the economy, which has its own ebbs and flows. For this reason, home builders cannot simply rely on old statistics, even if they aren’t terribly old. What was once a trend 5-10 years ago may be outdated or totally different today.
That being said, here are some fresher statistics that will give you a great grasp of where the home building industry is at currently.
50% of Home Buyers Find Their Home on the Internet (NAR)
It’s safe to say that just about every industry is experiencing an uptick in digital conversions, and the home industry is no exception. While you obviously can’t just add a home to an online cart and purchase it, finding a home online is a huge first step in ultimately buying it.
Because of this, home builders and sellers alike need to ensure that they are implementing adequate digital marketing strategies. For example, SEO is a huge part of getting in front of prospective homeowners, and all home builders should be investing in it if they haven’t already.
667,000 Newly Built homes Were Sold in 2018 (NAR)
That number shows just how healthy the home industry is. If you’re a home builder right now or are thinking about breaking into the industry, now is as good of a time as any. While 2020 and 2021 may have seen some decline due to COVID, which may drag into 2022, there is no reason that the industry will see any significant decline anytime soon. People will always need homes.
86% of Millennials aged 21-28 Were First-Time Home Buyers (NAR)
Wait, so you’re telling me that millennials are actually buying homes after all? And that all those rumors about them not buying homes were exactly that, rumors? It turns out that millennials don’t enjoy sinking money into rent month after month and instead are looking to invest in a home, just like everyone else.
The Cost of Renting Has Gone Up in 65% of U.S. Counties (Realtor)
As the last stat alluded to, the cost of renting is only going up in the majority of the U.S. For this reason, the home building market continues to see growth. Sinking money into renting just doesn’t make sense anymore.
The U.S. Housing Market Was Worth $33.8 Trillion in 2018 (Housing Wire)
That is an extremely big number and one that once again illustrates the sheer size of the market. As we mentioned before, the market does have its fair share of ups and downs. But, it has remained steady for quite some time now.
How to cite this page
Hook Agency, “Construction Statistics (2026),” hookagency.com/blog/construction-statistics/, updated November 2026. For any single number, please cite the original source linked next to it.
Frequently Asked Questions
How big is the construction industry in 2026?
US construction spending was $2.16 trillion in 2025, and 2026 is running about 2.9% behind that pace through September, per the Census Bureau.
How many people work in construction?
About 8.36 million as of September 2026, according to the BLS.
How much do construction workers make?
Average hourly earnings for construction employees were $41.69 in September 2026 (BLS).
Are construction costs going up?
Yes. Construction materials prices were up 9.6% year over year in May 2026, according to ABC’s analysis of BLS data.
Is there a construction labor shortage?
Yes. ABC estimates the industry needs 349,000 net new workers in 2026, and 92% of firms report trouble filling positions (AGC and NCCER, 2025).